

AROS Debugging ManualThe AROS Debugging reference Manual. IntroductionThis manual aims to aid in debugging AROS code, and explains various options for debugging AROS or generated binaries. ConfiguringTo enable debug builds of AROS it is necessary to pass the --enable-debug option to the configure script, before compiling AROS. Please note though that by doing so, extra debugging information will be generated, and will increase the disk size occupied by the AROS build tree considerably. Debug information/symbols will be stored in additional *.dbg files. N.B.: Due to a lack of native debugging tools, using the hosted AROS port under Linux or BSD is the prefered way to develop code. This allows host tools, such as GDB under Linux, to be used to debug AROS. Low-level hardware developers will more likely test in native environements, using the serial ports to output debug, though some devices may also be tested under hosted builds (needs citation). Printing debug statements
#define DEBUG 1
#include <aros/debug.h>
...
D(bug("value1=%ld, path=%s", value, path);)
D() will expand to nothing if DEBUG is 0 or undefined. Use bug() alone to force debug output whatever is the value of DEBUG. The usage is the same as printf(). On hosted, the output will be displayed in the console where AROS has been started. On native you have to use the tool Sashimi. With AROS hosted: using GDBYou can either run AROS under GDB, or use GDB after AROS has terminated and left a core dump. Don't forget to compile AROS with debugging enabled first (./configure --enable-debug). If you need to debug a problem that only arises without --enable-debug you can try to ./configure --enable-debug --with-optimization=-O2. GDB must be started from the directory where the file .gdbinit exists, not from the boot subdirectory. przypis Look out for any warnings when GDB is started. These may indicate that the .gdbinit file providing AROS-specific features was not loaded due to GDB's security features. Instructions for fixing this problem will usually be indicated within the warning. Live debuggingTo debug AROS code using GDB, you will first need to change to the directory the AROS binaries reside in, and invoke GDB like below: > cd ./bin/linux-i386/AROS/ > gdb boot/linux/AROSBootstrap If you are debugging the host bootstrap code or kernel, invoke GDB using the following command instead: > gdb boot/linux/AROSBootstrap --symbols boot/linux/AROSBootstrap.dbg GDB Will then launch and load the AROS bootstrap binary, displaying some information in the process: GNU gdb 6.0-debian Copyright 2003 Free Software Foundation, Inc. GDB is free software, covered by the GNU General Public License, and you are welcome to change it and/or distribute copies of it under certain conditions. Type "show copying" to see the conditions. There is absolutely no warranty for GDB. Type "show warranty" for details. This GDB was configured as "i386-linux"... (gdb) At this point, you can run AROS with: (gdb) r Starting program: /AROS/bin/linux-i386/AROS/boot/linux/AROSBootstrap (... lots of debug output follows ...) - Arguments can be passed to AROS by placing them after the ``r`` command. - Use Ctrl-C in the shell to interrupt AROS and get back to the GDB prompt. - See GDB (basic commands) for additional commands. Post-mortem debuggingBefore post-morten debugging is possible you have to enable core dump generation, using e.g. ulimit for the Bash shell. It is then possible to run AROS and generate a usable core dump: > cd /AROS/bin/linux-i386/AROS/ > ulimit -c unlimited # see your shell manual to enable core dumps > ./boot/linux/AROSBootsrap Quit (core dumped) Once the dump has been generated, it can be analyzed in GDB by specifying the aros executable name, followed by the core file: > gdb boot/linux/AROSBootsrap core GNU gdb 6.0-debian Copyright 2003 Free Software Foundation, Inc. GDB is free software, covered by the GNU General Public License, and you are welcome to change it and/or distribute copies of it under certain conditions. Type "show copying" to see the conditions. There is absolutely no warranty for GDB. Type "show warranty" for details. This GDB was configured as "i386-linux"... Core was generated by `boot/linux/AROSBootsrap'. Program terminated with signal 3, Quit. Reading symbols from /usr/X11R6/lib/libX11.so.6...done. Loaded symbols for /usr/X11R6/lib/libX11.so.6 Reading symbols from /usr/X11R6/lib/libXext.so.6...done. Loaded symbols for /usr/X11R6/lib/libXext.so.6 Reading symbols from /lib/libc.so.6...done. Loaded symbols for /lib/libc.so.6 Reading symbols from /lib/libdl.so.2...done. Loaded symbols for /lib/libdl.so.2 Reading symbols from /lib/ld-linux.so.2...done. Loaded symbols for /lib/ld-linux.so.2 #0 0x40125607 in sigsuspend () from /lib/libc.so.6 (gdb) GDB (basic commands)The command help gives help on all GDB commands. Either invoke it directly to get a list of known help subject, or followed by a topic or the name (or even abbreviation) of a command. You're encouraged to read the online help for all the commands that will be briefly presented here. The command bt (backtrace) prints a backtrace of all stack frames. Here is a backtrace after interrupting AROS with Ctrl-C in the GDB console: Program received signal SIGINT, Interrupt. 0x40125607 in sigsuspend () from /lib/libc.so.6 (gdb) bt #0 0x40125607 in sigsuspend () from /lib/libc.so.6 #1 0x080531d5 in idleTask (sysBase=0x40231290) at idletask.c:23 #2 0x08052ba7 in Exec_NewAddTask (task=Cannot access memory at address 0x8 ) at newaddtask.c:280 Previous frame inner to this frame (corrupt stack?) (gdb) The innermost frame is #0. To print the value of an expression accessible from the current frame, use p (print): (gdb) p SysBase $1 = (struct ExecBase *) 0x40231290 GDB's print command is very powerful. As it understands the C syntax, you can print any valid expression:
(gdb) p SysBase->IntVects[2]
$2 = {iv_Data = 0x0, iv_Code = 0x8052f30 <SoftIntDispatch>, iv_Node = 0x4023c528}
You can also use print as a hex calculator, like: (gdb) p 0x42 + 0xc0de $1 = 49440 To display the result in hex, use p/x (notice how you can recall a previous expression): (gdb) p/x $1 $2 = 0xc120 To move between frames, use the command f (frame): (gdb) f 1 #1 0x080531d5 in idleTask (sysBase=0x40231290) at idletask.c:23 23 sigsuspend(&sigs); To display 10 source lines around the current location, use l (list), which can also be used to display a specific line. If you are doing live debugging:
Use q to quit: (gdb) q The program is running. Exit anyway? (y or n) y > GDB (AROS-specific)AROS-specific GDB commands are supplied in /AROS/_gdbinit, which gets installed to /AROS/bin/linux-i386/AROS/.gdbinit. This file is read by GDB on start-up, and contains the following commands: findaddr - Shows the module that contains the given address thistask - Print out information about the currently running task. liblist - List the current libraries in the system devlist - List the current devices in the system resourcelist - List the current resources in the system residentlist - List the system resident list taskready - List of tasks current ready to run taskwait - List of tasks currently waiting for an event modlist - List of all the modules currently loaded in memory printtaglist - Display the given taglist loadseg - Findaddr & add-symbol-file Of this list, findaddr is essential for proper debugging of non-ROM code (shared libraries, applications ...) Using findaddrMost often, you will want to debug libraries or applications, but a backtrace gives you one or more unresolved addresses:
Core was generated by `aros'.
Program terminated with signal 11, Segmentation fault.
Reading symbols from /usr/X11R6/lib/libX11.so.6...done.
Loaded symbols for /usr/X11R6/lib/libX11.so.6
Reading symbols from /usr/X11R6/lib/libXext.so.6...done.
Loaded symbols for /usr/X11R6/lib/libXext.so.6
Reading symbols from /lib/libc.so.6...done.
Loaded symbols for /lib/libc.so.6
Reading symbols from /lib/libdl.so.2...done.
Loaded symbols for /lib/libdl.so.2
Reading symbols from /lib/ld-linux.so.2...done.
Loaded symbols for /lib/ld-linux.so.2
#0  0x080c8830 in Intuition_SetAttrsA (object=0x317ceb, tagList=0x402f7504,
    IntuitionBase=0x40289dfc) at setattrsa.c:84
84          result = DoMethodA (object, (Msg)&ops);
(gdb) bt
#0  0x080c8830 in Intuition_SetAttrsA (object=0x317ceb, tagList=0x402f7504,
    IntuitionBase=0x40289dfc) at setattrsa.c:84
#1  0x402bd919 in ?? ()
#2  0x00317ceb in ?? ()
#3  0x402f7504 in ?? ()
#4  0x40289dfc in ?? ()
#5  0x8042bfe0 in ?? ()
#6  0x404ca36c in ?? ()
Use findaddr on any address you want to resolve (probably the innermost): (gdb) findaddr 0x402bd919 Searching in the loaded modules... Address found in System:Tests/Zune/list1, which is loaded at 0x402bd454. If this is an executable, its .text section starts at 0x402bd460 Next you'll use the add-symbol-file command to load the given file's debug symbols at the given text address: (gdb) add-symbol-file Tests/Zune/list1.dbg 0x402bd460 add symbol table from file "Tests/Zune/list1.dbg" at .text_addr = 0x402bd460 (y or n) y Reading symbols from Tests/Zune/list1.dbg...done. Hopefully it has resolved the addresses:
(gdb) bt
#0  0x080c8830 in Intuition_SetAttrsA (object=0x317ceb, tagList=0x402f7504,
    IntuitionBase=0x40289dfc) at setattrsa.c:84
#1  0x402bd919 in main () at list1.c:107
#2  0x402bd5d1 in __startup_entry (argstr=0x402bcd24 "\n", argsize=1,
    sysbase=0x40232290) at startup.c:102
#3  0x080580a7 in Dos_RunProcess (proc=0x403f76f0, sss=0x403daac4,
    argptr=0x402bcd24 "\n", argsize=1, entry=0x402bd458, DOSBase=0x402a6888)
    at runprocess.c:123
#4  0x0806a1c7 in Dos_RunCommand (segList=0x402bd454, stacksize=40960,
    argptr=0x402bcd24 "\n", argsize=1, DOSBase=0x402a6888)
    at runcommand.c:107
#5  0x40400461 in ?? ()
#6  0x402bd454 in ?? ()
#7  0x0000a000 in ?? ()
#8  0x402bcd24 in ?? ()
#9  0x00000001 in ?? ()
#10 0x402a6888 in ?? ()
So hopefully you can find the error: (gdb) f 1 #1 0x402bd919 in main () at list1.c:107 107 set(3243243, MUIA_Window_Open, TRUE); Repeat for the remaining addresses you wish to resolve. There is the loadseg function which makes findaddr and add-symbol-file in one step. Use it with the address argument which you'd use with findaddr. Using thistaskThe thistask command displays various from the currently running task. Not surprisingly, this is the data found in SysBase->ThisTask: (gdb) thistask Task SigWait SigRecvd StkSize StkUsed Pri Type Name -------------------------------------------------------------------------- 40231fb8 00000000 00000000 40960 872 -128 1 Idle Task Tips and tricksApplication developers need to ensure that their programs release all the resources they take. AROS provides some tools for this (needs citation). Program-induced breakpoint on i386If you insert:
asm("int3");
in C code, a trace exception will be generated at execution. This can be very useful while running with GDB, to enter interactive debugging when a specific condition occurs:
if (byteSize == 112)
    asm("int3");
Debugging without build systemYou can debug applications and modules which weren't created by the build-system. You have to build them debugging-friendly, as described in the GDB manual under "Compiling for Debugging". In short: use -g, don't use -O or -fomit-frame-pointer. Of course, AROS itself must be built with --enable-debug. GUI frontendsThere exist GUI frontends for GDB, e.g. ddd. With AROS hosted: using CallgrindIntroductionCallgrind is method call profiler, part of Valgrind suite. By using it you will be able to see which AROS or 3rd party application functions take the most time in certain test scenarios and you will be able to improve them. Callgrind will correctly detect method addresses on the AROS side, but it will not be able to turn them into symbol names. To do that a little post-processing of Callgrind output file is needed. Steps to use Callgrind with AROSPrepare AROS buildCallgrind will work with off-the-shelf AROS build but in such build some methods are in-lined/optimized and you will not see them in trace output. To get most out of Callgrind build AROS with the following command line: > ./configure --target=<your hosted arch> --enable-debug=symbols Start AROS via CallgrindStart AROS using this command line: > cd /AROS/bin/linux-i386/AROS/ > valgrind --tool=callgrind --trace-children=yes --instr-atstart=no ./boot/AROSBootstrap Explanation of options:
Enable instrumentationNow that you started AROS and did the preparation tasks, it is time to start instrumentation so that the actual measurement takes place. Open a new shell and issue the following command: > callgrind_control -i on przypis It often happens that issuing this command causes crash of Valgrind. It is probably related with something that AROS does. In order to decrease crash rate, make sure AROS "does" something when this command is issued. The simplest case that works is opening a System: drawer in Wanderer and issuing the command while AROS opens the drawer. przypis Depending on your Linux distribution you might be lacking required privileges for the callgrind_control command to work correctly. If you see the following error: "Note: your kernel restricts ptrace invoker using /proc/sys/kernel/yama/ptrace_scope", be sure to execute this command as root: echo 0 > /proc/sys/kernel/yama/ptrace_scope przypis Callgrind_control under Ubuntu 12.04 has a bug which can be fixed by changing line 32 to: if (/^use --pid=(d+) for S*?valgrind.bins+(.*?)s*$/) { Running the test scenarioRun the test scenario. You might want to run it several times to get more averaged measurements. Dumping measurements and AROS-side symbolsOnce the test is over, you need to dump Callgrind measurements to file. You do this by issuing the following command: > callgrind_control -d This will create two files in the AROS root directory, both following this pattern: callgrind.out.<pid>.<n> The "pid" is the process ID, "n" means consecutive dump number. The second part of data dumping requires you to dump AROS-side symbols. To do that it is first advised to turn off instrumentation, otherwise dumping will take a lot of time (around a minute). This is done by using the following command: > callgrind_control -i off przypis See the note on crashes when turning on instrumentation. The same problems apply with turning off instrumentation. In order to dump the symbols to file, open AROS Shell and type in following command: > SymbolDump This will create symbols.out file in AROS root directory. Post-process Callgrind outputThis is the last step of the process where you need to enhance the output generated by Callgrind. Right now it only has addresses, but what is needed to analyze the output are actual AROS-side symbol names. This is achieved by running the following command: > python vgpostprocess.py callgrind.out.<pid>.<n> symbols.out Remember to use the higher pid as it relates to actual AROS instance. This tool will generate a callgrind.out.<pid>.<n>.processed file. Analysis of outputIt is best to analyze the output in graphical form. The best tool to do this is KCachegrind. Here is an example output from Callgrind opened in KCachegrind. 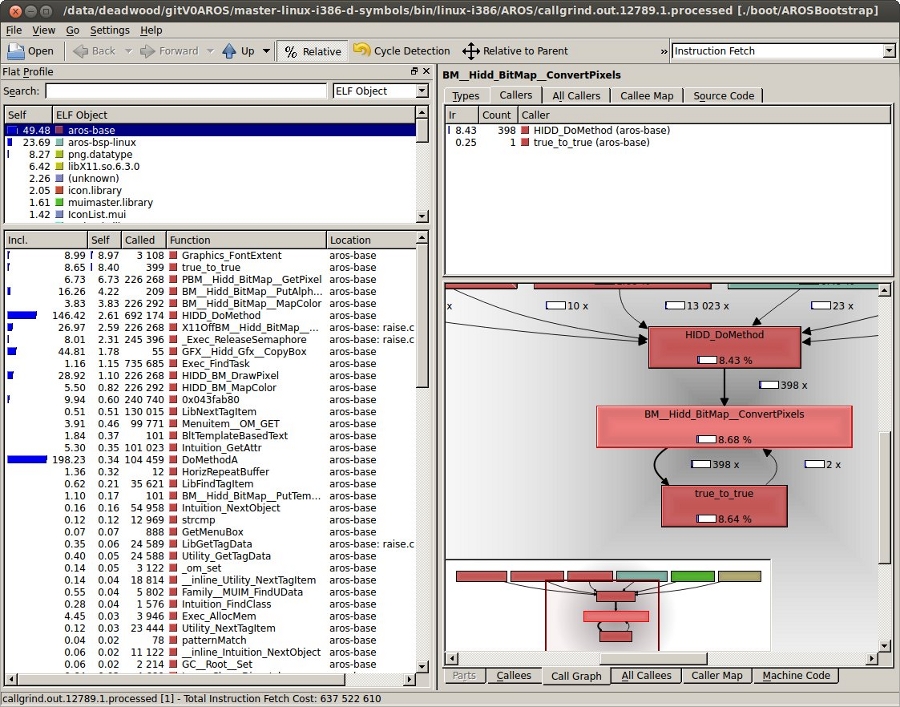
Resource trackingResource Tracking as known from other OSes isn't readily available for AROS at the moment, so you'll have to take care of releasing resources yourself. Some tools are described here that will help you check that your program is clean. Tracking memory with MungwallIf configured with --enable-debug, AROS enables Mungwall. Additionally, you have to add mungwall to the command line arguments when starting AROS. One of the things that does is to keep track of "walls", small zones before and after your memory allocations, to verify that you don't write out of your bounds. This check is done in the memory allocation routines, or additionally at any time by calling AvailMem(MEMF_CLEAR). The CheckMem command line tool just calls this function, and reports to the debug output (serial for native, or terminal for hosted). If no bound violation has been detected, it will report the current number of allocations and their total size: === MUNGWALL MEMORY CHECK ============ Num allocations: 1579 Memory allocated 3333326 LeakWatchIt's a dumb but helpful tool. It tracks down total memory and Exec objects: libraries, devices, fonts, resources, ports and semaphores. It triggers a flush of the unused objects still in memory to report the real amount of memory after some resources are closed. Launch LeakWatch in its own shell, then use the following keys:
Ctrl-F is the most useful key: hit it before running your program, then after. It should report no resources. In the opposite case:
If you think that your program triggered a leak in an AROS library, find an existing test program or write a small one that just ues the leaking calls, to ensure that the leak really comes from those calls in that library. Miscellaneous CLI toolsThere are also simpler debugging tools available in C:. AROS ShellType set __debug_mem in the Shell to enable reporting available memory before and after each command, as well as the memory difference. Mostly the same as LeakWatch for memory only. AvailUse Avail to display informations on memory. The FLUSH parameter will force unused objects to be expunged. LiblistIt displays a list of the currently opened libraries as well as some info, like version and open count. DevlistSame as Liblist, but for Exec Devices. Misc Wanderer toolsSnoopySnoopy (System:System/Snoopy) patches some library functions in such a way that their arguments and result are print to the debugging console. SashimiSashimi (System:Developer/Debug/sashimi) shows all debugging output in a Wanderer window. This is useful when you want to see debug output of AROS when it's build without debug support or you can't read the serial output. ScoutScout is a tool that allows you to monitor your computer system. It displays many different things -- like tasks, ports, assigns, expansion boards, resident commands, interrupts, etc. -- and you can perform some certain actions on them. Tips and tricksMungwall check in the schedulerA neat Mungwall trick is to modify the scheduler to call AvailMem(MEMF_CLEAR) on each task switch, when you have a strange memory corruption that you can't trace by other means. This way you'll force a memory check after each task has had its time quantum. It's slow, but there's no way the culprit can escape. Memory leaks
|
|||||||||


Copyright (C) 1995-2024, The AROS Development Team. Wszystkie prawa zastrzeżone.
Amiga(R), AmigaOS(R), Workbench i Intuition are znakami towarowymi Amiga Inc. Wszystkie inne znaki towarowe należą do ich prawnych właścicieli. |